
About this program
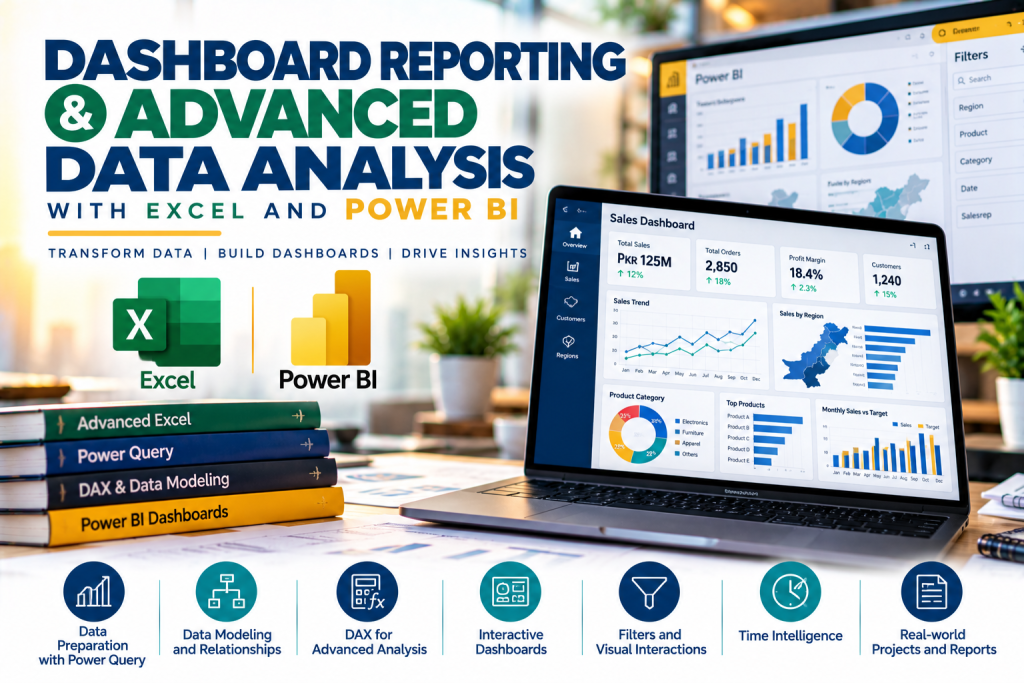
Turn Raw Numbers into Decisions That Lead
You have the data. What you need is the story it tells — fast, clearly, and in a format that makes decision-makers sit up. Whether it’s a monthly sales summary buried in rows and columns, or KPIs no one can read at a glance, the gap between raw data and real insight costs organizations every single day. This course closes that gap — hands-on, in Excel, with zero fluff.
🎯 What You’ll Gain
After the workshop, you will be able to:
- Build high-quality, interactive dashboards that surface your organization’s KPIs at a glance
- Transform raw, messy data into structured, analysis-ready formats using proven Excel techniques
- Design advanced charts and polished visuals that communicate — not just decorate
- Automate dashboard interactivity using form controls, Slicers, PivotTables, and macros
- Gain the confidence to lead data reporting in your team without depending on IT or specialists
📋 Key Course Modules
- Foundations of dashboards — what makes a dashboard effective
- Preparing and cleaning data for reporting and dashboards
- Building interactive dashboards using form controls
- Advanced charting techniques and formatting for polished visuals
- Creating dashboards using PivotTables and Slicers
- Incorporating macros for interactivity and automation
📚 How We Learn
Expect a hands-on, immersive experience built around:
- Live, step-by-step Excel exercises — every concept applied immediately
- Individual and group practice sessions
- Real-world business reporting scenarios
- Interactive class discussions and Q&A
👥 Who Should Attend?
If you work with data regularly — as a business analyst, reporting analyst, sales or marketing executive, or project manager — and you find yourself spending hours reformatting spreadsheets only to produce reports that still don’t land the way you intended, this course was built for you. Intermediate Excel users who want to move from “functional” to “impressive” will find exactly what they need here.
Note: The fee is exclusive of GST.
Meet your instructor

Muhammad Aleem Habib
Senior Consultant / Trainer
Specialization: Microsoft Excel, Power BI, Generative AI, Team Building, Dashboards
View profile